
Performance Highlights
Fiscal Year Ended December/31/2024 (Fiscal 2024)
On July 1, 2023, FISCO Ltd. merged its consolidated subsidiary, FISCO Consulting Ltd. into FISCO Ltd..
As a result, from the cumulative period of the third quarter of the fiscal year ending December 2023, FISCO Ltd. has changed the disclosure that was previously made on a consolidated basis to a non-consolidated disclosure.
In addition, starting from the 31st fiscal year, we have changed the way we present valuation losses on crypto assets
for which there is no active market from “sales” to “cost of sales.”
For the 30th fiscal period, the indicators have been revised to reflect the changes in presentation method.
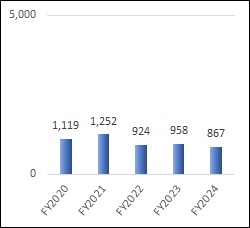
- Net sales (Million yen)
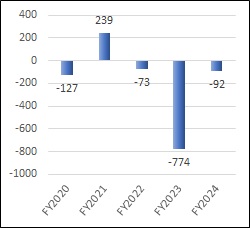
- Ordinary income (Million yen)
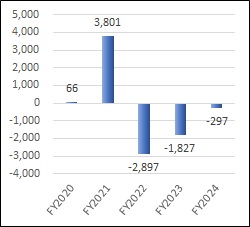
- Net income (Million yen)
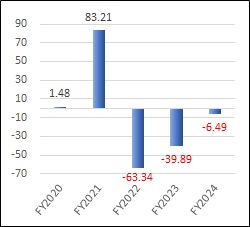
- Net income per share (Yen)
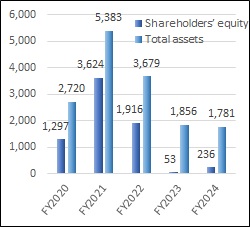
- Shareholders’ equity & Total assets (Million yen)
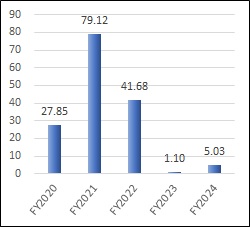
- Net assets per share (Yen)
| Fiscal Year | Net sales | Operatingincome | Ordinaryincome | Net income | Net incomepershare | Returnon equity(ROE) | Returnon assets (ROA) | Operatingmargin | |
|---|---|---|---|---|---|---|---|---|---|
| (Million yen) | (Million yen) | (Million yen) | (Million yen) | (Yen) | (%) | (%) | (%) | ||
| FY2024Fiscal year ended December/31/2024 | Full year | 867 | △327 | △325 | △530 | △11.58 | △203.4 | △16.7 | △37.7 |
| 3Q | 622 | △334 | △333 | △504 | △11.00 | – | – | – | |
| 2Q | 393 | △323 | △322 | △131 | △2.87 | – | – | – | |
| 1Q | 193 | △50 | △49 | △50 | △1.10 | – | – | – | |
| FY2023Fiscal year ended December/31/2023 | Full year | 961 | △622 | △537 | △1,591 | △34.72 | △136.3 | △18.2 | △64.7 |
| 3Q | 704 | △399 | △313 | △302 | △6.60 | – | – | – | |
| 2Q | 388 | △254 | △241 | △236 | △5.16 | – | – | – | |
| 1Q | 196 | △192 | △190 | △184 | △4.02 | – | – | – | |
| FY2022Fiscal year ended December/31/2022 | Full year | 1,071 | 46 | 73 | △2,750 | △60.13 | △96.9 | 1.9 | 4.3 |
| 3Q | 915 | 157 | 187 | 183 | 4.02 | – | – | – | |
| 2Q | 623 | 126 | 156 | 154 | 3.38 | – | – | – | |
| 1Q | 336 | 87 | 117 | 116 | 2.54 | – | – | – | |
| FY2021Fiscal year ended December/31/2021 | Full year | 1,252 | 226 | 239 | 3,801 | 83.21 | 155.5 | 4.4 | 18.1 |
| 3Q | 934 | 172 | 190 | 4,023 | 88.06 | – | – | – | |
| 2Q | 632 | 119 | 195 | 785 | 17.20 | – | – | – | |
| 1Q | 343 | 90 | 167 | 758 | 16.60 | – | – | – | |
| FY2020Fiscal year ended December/31/2020 | Full year | 1,119 | 62 | △127 | 66 | 1.48 | 6.6 | △4.7 | 5.5 |
| 3Q | 717 | △82 | △246 | △85 | △1.91 | – | – | – | |
| 2Q | 449 | △97 | △113 | 27 | 0.62 | – | – | – | |
| 1Q | 236 | △46 | 20 | 21 | 0.47 | – | – | – |
This website is not intended to solicit or recommend investments in the companies whose information is provided here. You should not base investment decisions entirely on the information found on this website. You should make investment decisions based on your own judgment.